Welcome to this month’s “what in the world is going on in residential real estate” economic update.
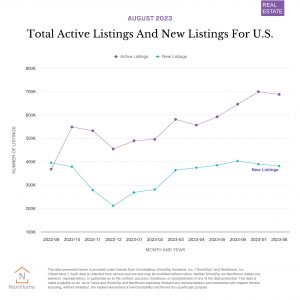
I thought it would be fun (as much as macro-economics can be fun) to dig in on the Total Active Listings and New Listings chart below:

The purple line is the Total Active Listings in the US. and the blue line is the New Listings (new to the market). When looking at the graph, you might logically ask the question, “If new listings are trending down and active listings are (basically) flat, how is this happening?”
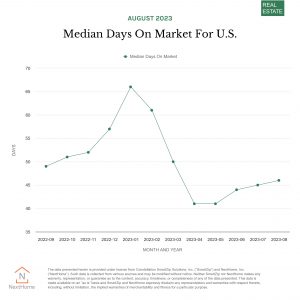
The answer is that properties are sitting on the market longer. If a new listing comes on the market and doesn’t sell with speed, then you see it linger on the chart as an “Active Listing.” You can tease that out of the data by looking at the Median Days On Market. If that metric is trending up (which it is), then you will see the gap between new listings and active listings widen.

So we’ve been clamoring for “more inventory” for a while now and we’re starting to get it. The unfortunate part is we’re getting it when we always get it, which is in the winter. Due to seasonality, the real estate buyers market slows down faster than a sloth in a straight jacket as we get closer and closer to Halloween. Basically, as the holidays approach, people stop looking for homes as aggressively as they focus on other things.
There is a window for the buyer of 2023 to find their house if they’re willing to focus and push through the inconvenience of looking when most people don’t want to search for a home. I have often said I don’t believe in timing the market. People buy because of timing in their life. For those buyers who can maintain some focus over the next 90 days, you could see a bump in inventory and an opportunity to get your foot in the door (pun intended).